Draw Tracing
Draw tracing is a tool that aids you in understanding how long your draw calls take. The process involves running the tool on the Magic Leap 2 (ML2) device to generate a trace log on the device while your app is running. This captures the relevant app activity in the file. The file is then transferred onto the host PC to view in the browser. The tool used on device is called Perfetto, and when it's run it generates a file called trace.pftrace on the device.
Prerequisites
Before you start using draw tracing, make sure you have the following:
- Magic Leap Hub installed
- A Magic Leap 2 connected to your host PC
- Perfetto Installed via Magic Leap Hub's (ML Hub) Package Manager
Set up adb
You need adb (Android Debug Bridge) to communicate with your device and run the draw tracing commands. adb is part of the Magic Leap Hub installation. To set up adb, follow these steps:
- Find the adb.exe file in your Magic Leap Hub folder. The default location is
C:\Users\_user_\MagicLeap\MLHub\plugins\com.magicleap.adb.win32.x86_64_1.0.41.28_0_2_202304071616\adb\adb.exefor Windows. - Add the adb.exe file path to your Path environment variable on Windows. This allows you to run adb commands from any directory.
- Open a command prompt and run the following command to check if adb is working:
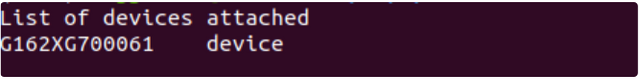
adb devices
- You should see your device listed as connected.
- Run the following commands to enable the properties required for draw tracing:
adb shell setprop persist.traced.enable 1
adb shell setprop ml.graphics.tracing.vk.enable 1
adb shell setprop ml.graphics.tracing.gl.enable 1
You now know how to configure adb for draw tracing.
Trace Your Application
To trace your application, you need a config file that specifies what data to capture and how long to capture it for. You can choose between two options: a full log or a graphics log.
- A full log captures graphics data as well as other processes such as power, audio, and video. This can provide more context for your analysis, but it also generates a larger file size and may include unnecessary information.
- A graphics log captures only graphics data, which can be sufficient for most draw tracing scenarios. This generates a smaller file size and focuses on graphics data.
- Choose the config file that matches your preference:
Click the respective link to open the configuration file and save the file.
Rename your saved file based on the chosen configuration:
- For Full Log: config-full-with-draw-tracing.cfg
- For Graphics Log: config-with-draw-tracing.cfg
Launch your application on the device and run the following command in a command prompt while the application is running:
type config-with-draw-tracing.cfg | adb shell perfetto --txt --config - --out /data/misc/perfetto-traces/trace
This command uses the config file to capture the app activity for 3 seconds by default and saves it as a trace.pftrace file on your host PC. You can change the capture duration in the config file by modifying the duration_ms field. For example, to capture for 10 seconds, change it to duration_ms: 10000.
- After the trace is complete, run the following command to pull the trace file from the device:
adb pull /data/misc/perfetto-traces/trace ./trace.pftrace
Analyze the Trace File with Perfetto
To analyze your trace file, you can use Perfetto, which is a web-based UI that allows you to visualize and explore the trace data. Perfetto is integrated with ML Hub and can be launched from there. To analyze your trace with Perfetto, follow these steps:
Open Magic Leap Hub.
On the Perfetto tile, click Launch.
In the browser window that opens, click Open trace file. and select your trace.pftrace file.
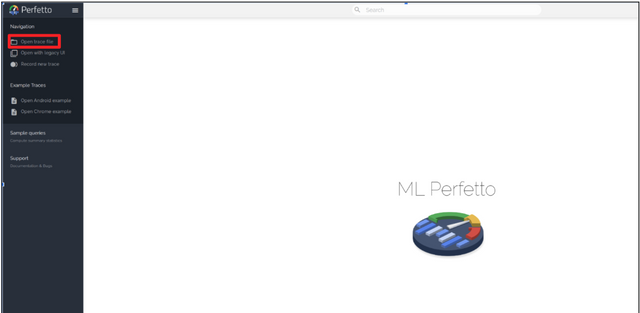
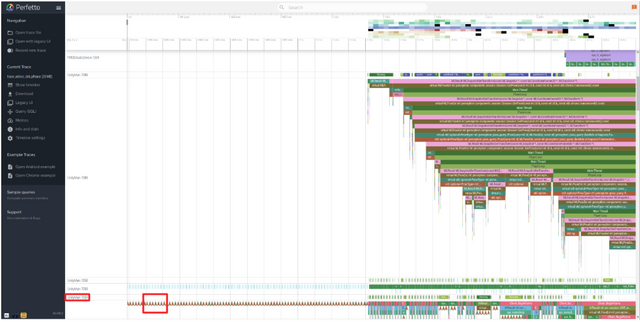
Open Trace File You should see a timeline window that shows all the API calls made by each application.
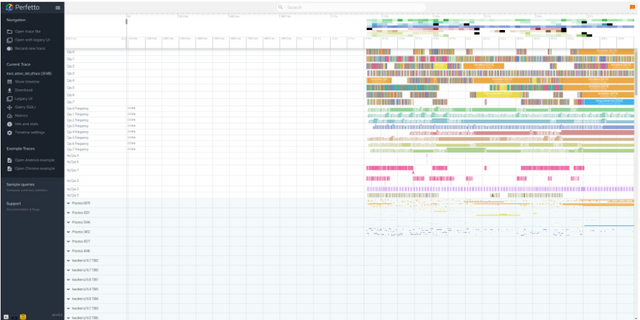
You can use any trace file you like, but for this walkthrough, we use a trace file from the AR Brochure Demo App.
- Find the process that corresponds to your application, you need to look at the process names and IDs in the left panel of Perfetto. If the process name is not shown, you can use the process ID as a clue. Usually, the first two or three process IDs are related to your application. You can also hover over the process name or ID to see more details.
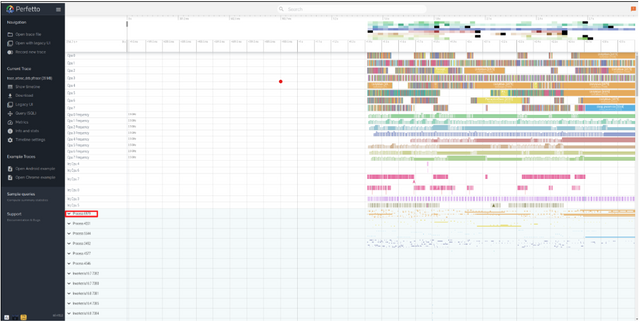
- Draw tracing adds markers for each draw performed on a thread. You can see some of them in the second red box. AR Brochure is a Unity app, so search for the thread with these arrows.
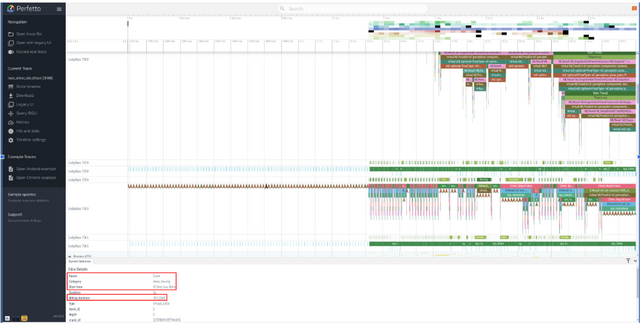
- Clicking on a marker reveals information about the draw call. debug.duration is in nanoseconds(ns).
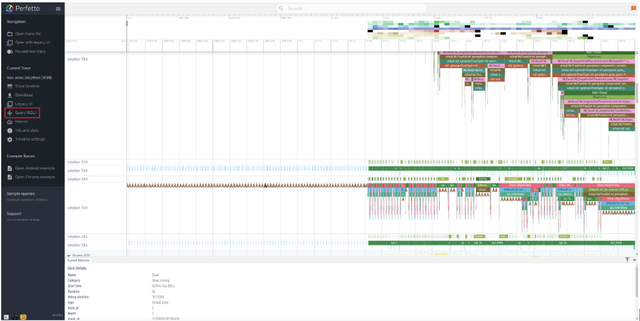
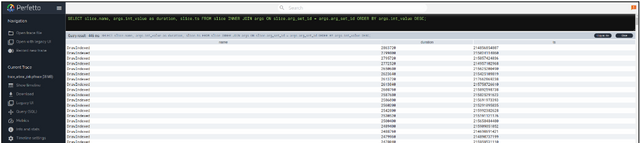
- To find the list of longest-running draw calls, click on the Query(SQL) tab on the left panel of Perfetto to run a SQL query and get a list of all the draw calls sorted by their duration.
- Run the following query:
SELECT slice.name, args.int_value as duration, slice.ts FROM slice INNER JOIN args ON slice.arg_set_id = args.arg_set_id ORDER BY args.int_value DESC;
This query returns a list of API calls in descending order of duration in nanoseconds (ns).
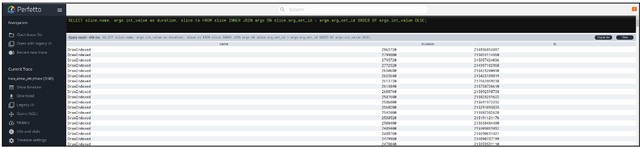
- The general guidance is that draws should not exceed 2ms. In the example below, you can see numerous draws exceeding that threshold which can lead to bad performance.
You can now examine any of your traces using these steps as guidance.